MOLINE, Ill. — You've likely seen the dramatic images circulating social media showing massive sandbars, exposed islands and even submerged vehicles being exposed thanks to record-breaking low levels of water flowing through the Mississippi River, especially south of the Quad Cities.
How can it be that areas like Memphis, Tennesee are experiencing negative river levels on the Mississippi River while here in the Quad Cities our values are still positive and actually not too far away from average? This is a great question posed to me recently by Dave Levora over at our partner radio station, KQCJ Planet 93.3 FM.
At first glance, it really doesn't make any sense.
The Mississippi River level here in the Quad Cities as of Oct. 19, 2022, is 4.2 feet. The historical average for this date is 5.10 feet. That doesn't seem too abnormal, especially given the lack of rainfall here lately.
However, travel some 500 miles to the southeast to Memphis, Tennesee, and things are a lot more whacky. There you'll find the current stage for the Mississippi River is -10.7 feet. Say what!
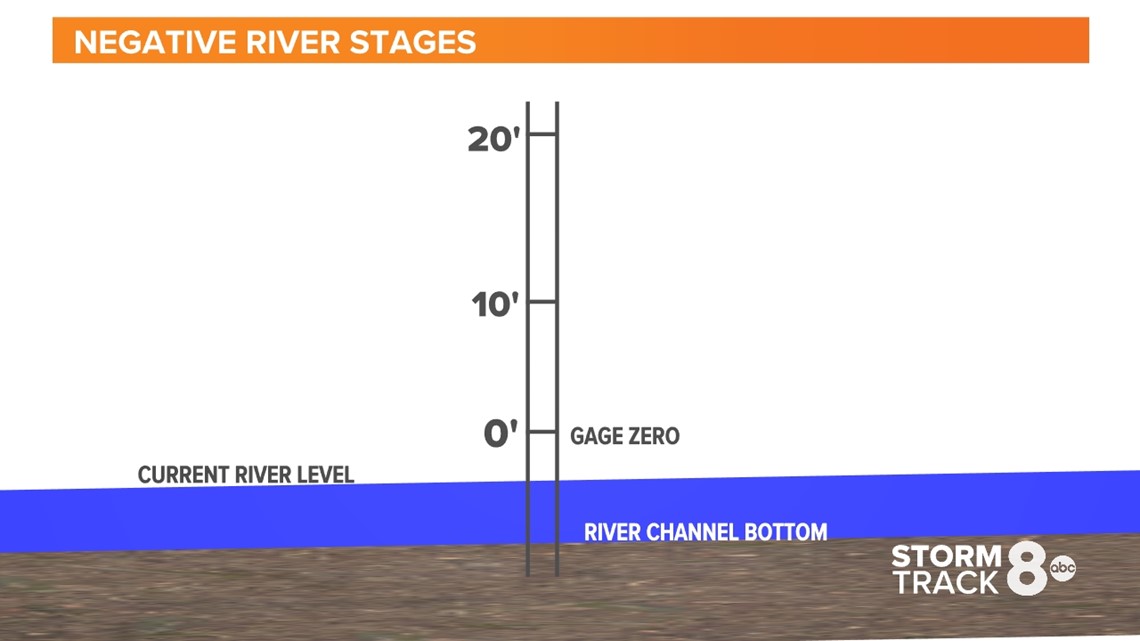
How can a river level be negative?
River gages were given arbitrary reference elevations hundreds of years ago. These reference levels haven't changed since. This reference level (also called zero) is a baseline. Silt deposits over time and even dredging all constantly impact the actual fluctuating "bottom" of the Mississippi River, which is why this arbitrary zero level is sued.


Why not update the zero so it matches the actual bottom of the river channel?
If we go about changing river gage levels, all the historical data for each gage site could be useless or at the very least, confusing, especially when looking back at past flood events.
You always want a starting data point that's constant. Otherwise, trying to compare different flood stages and levels from one event to the next becomes quite complicated because you are having to adjust the data to match your new starting points. That makes sense, right?
So, if the Mississippi River level is negative in Memphis, won't it eventually be negative here?
Not necessarily. The last time the Mississippi River level at the Rock Island Lock and Dam went negative was back in December of 1937. The reason Memphis and other locations south of the Quad Cities are seeing much lower water levels has to do with the lack of water feeding into the Mississippi River basin in that region. Here's what I mean.


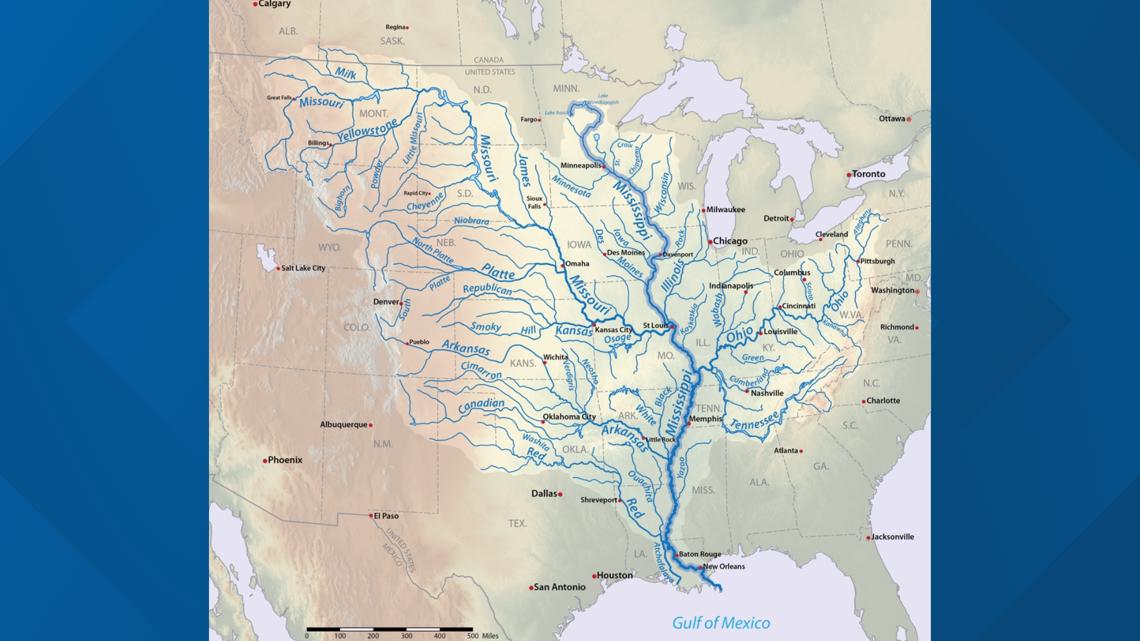
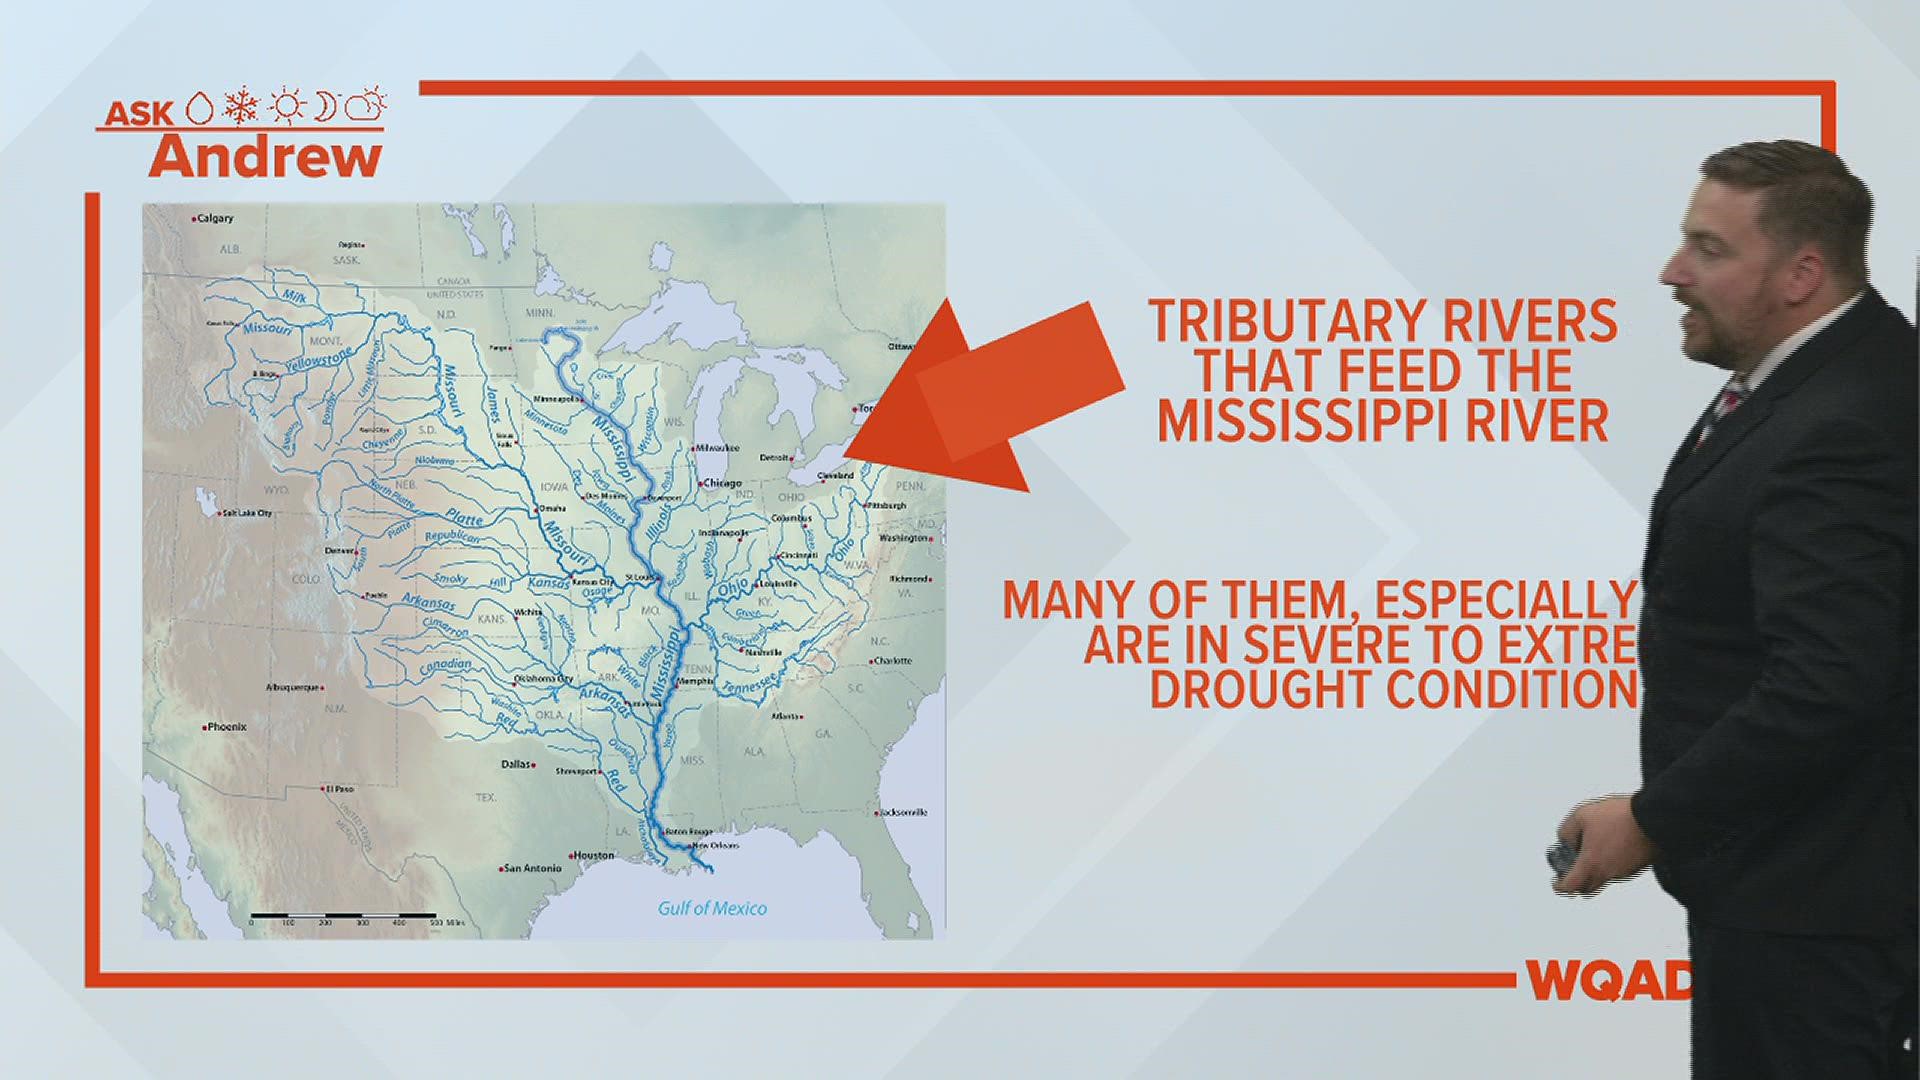
The map above shows all of the tributary rivers that feed water into the Mississippi River. This is important because it's not always about the rain that falls near or on top of the river. The biggest thing to take away from this map is the number of tributaries, or rivers feeding water, west of the Mississippi River versus east.
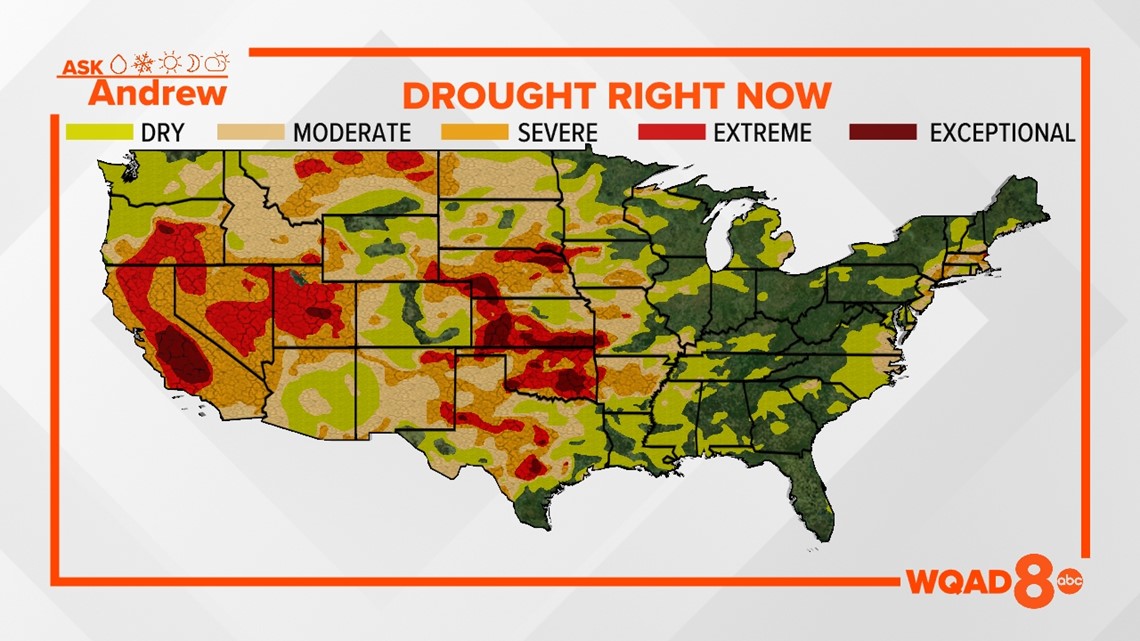
It's safe to assume that there is a lot more water volume flowing on the west side compared to the east side. Now, let's take a mental snapshot of this and apply it to the next map below, which shows expansive drought across much of the United States.


Notice that areas west of the river are in widespread, severe, and even extreme drought in spots. It's this lack of water flow, due to the lack of rain, that is causing significantly lower river levels south of the Quad Cities region. Until these regions receive meaningful rainfall, the river levels in areas like Memphis will not improve anytime soon.
Have a question that you would like me to answer for a future upcoming Ask Andrew segment? Submit it, here! And don't forget to check out more stories on News 8's YouTube channel.
Check out this video from Memphis:

