

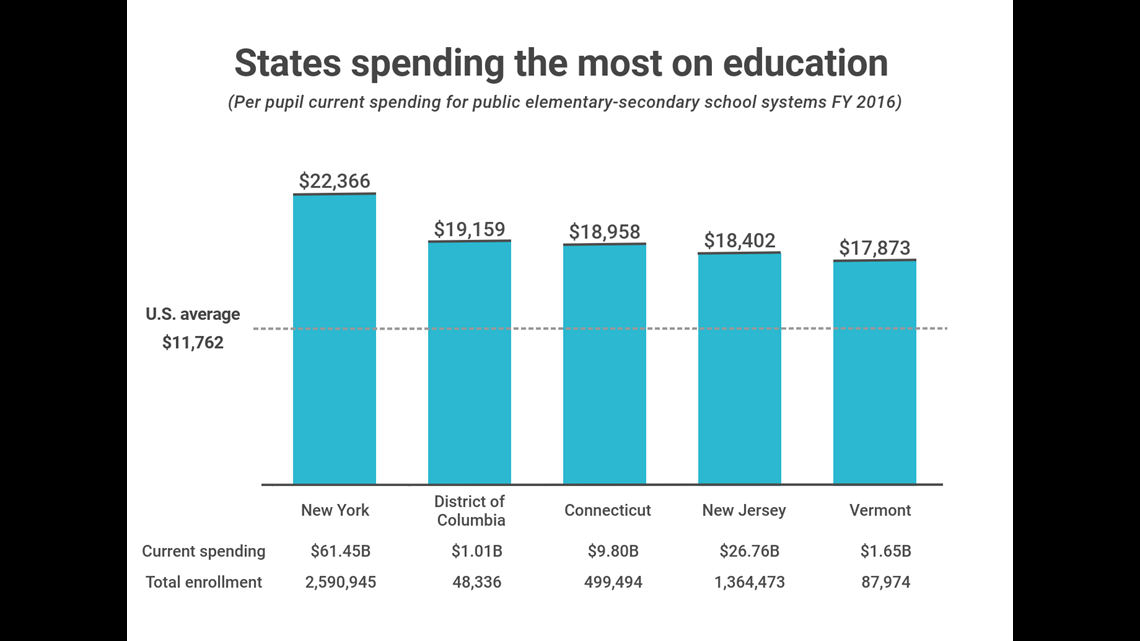
In the wake of multiple teacher strikes that have prompted national attention towards educators’ salaries and education spending, the U.S. Census Bureau just released its updated Annual Survey of School System Finances covering Fiscal Year 2016. According to the report, total current spending of public elementary-secondary school systems for the U.S. in 2016 was $587 billion, a 3.3% increase from 2015. With over 48 million students enrolled in school in the U.S., the per pupil current spending nationwide is $11,762, an increase of 3.2% since 2015.
Whether increased spending yields better outcomes or is a sign of bloated administrative costs is controversial. A recent study conducted by the University of California, Berkeley has indicated that higher education spending correlates with higher scores on the federal NAEP exam, while another study from the National Center for Education Evaluation and Regional Assistance reported no correlation between spending and test scores or graduation rates. Critics of educational spending argue that too much of the education budget (almost 40% at the national level) is allocated for teacher salaries, which average $58,950 nationwide, and should be spent on other programs and resources for students.
While in part funded from federal sources, public education in the U.S. is predominantly financed by state and local revenue sources, which creates large disparities in spending across states. To identify which states spend the most and least on public education, Credit Sesame, a credit score and financial management platform, analyzed the most recent U.S. Census Bureau data released in May of 2018. To compare spending figures against teacher salaries and student outcomes, Credit Sesame also incorporated data from the National Education Association, U.S. Department of Education, and the National Assessment of Educational Progress (NAEP).
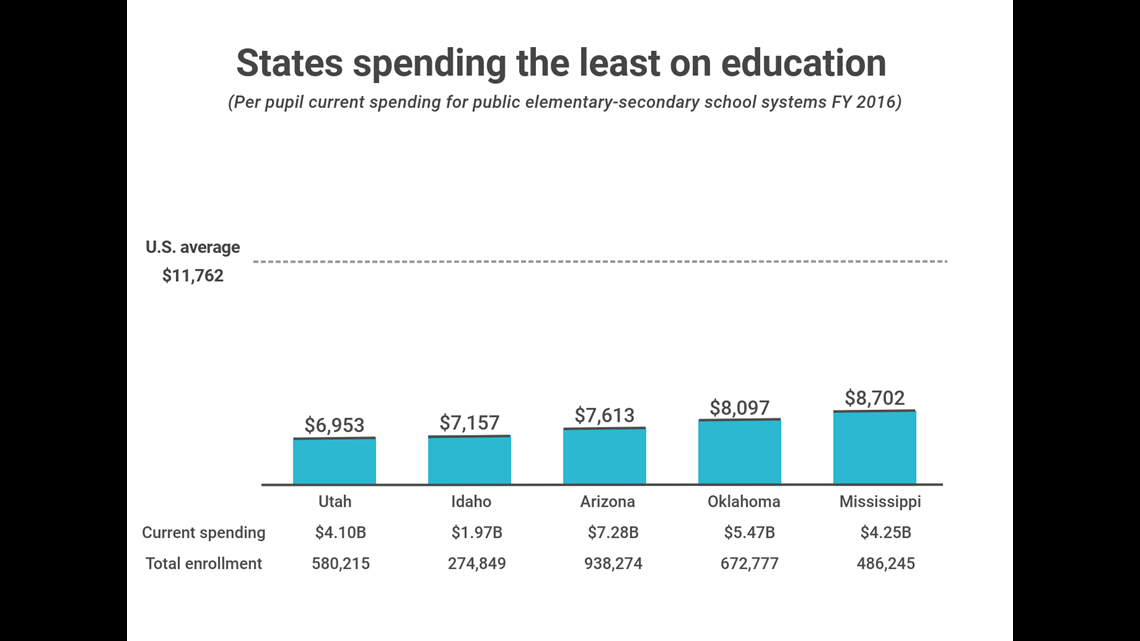
Based on the analysis, states in the Northeast tend to spend the most money per pupil, with New York (ranked #1) spending three times more per pupil than Utah (ranked #51).

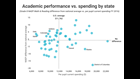
At the state level, per pupil spending is strongly correlated with average teacher salaries, which makes sense given the large portion of the budget that goes towards instructor salaries. However, when comparing state-level student outcomes (such as NAEP scores and graduation rates) with per pupil current spending, Credit Sesame found no obvious correlations—meaning that states spending the most per student today don’t appear to have better outcomes. In fact, some states such as Washington, D.C., Alaska, and Hawaii have significantly above average spending and below average academic performance. Conversely, states such as Utah, Indiana, Colorado, and Idaho appear to be doing more with less. Their students outperform those in other states on national assessments despite below average spending.

The states ranked (least to most spending):


51. Utah
- Per pupil current spending: $6,953 (51st)
- Per pupil current spending change from 2015: 5.8%
- Average teacher salary: $47,244 (46th)
- Nation’s Report Card performance: Better than average
- Graduation rate: 85.2% (27th)
- Total enrollment: 580,215 (28th)
- Total spending: $4.10 billion (34th)


50. Idaho
- Per pupil current spending: $7,157 (50th)
- Per pupil current spending change from 2015: 3.4%
- Average teacher salary: $47,504 (43rd)
- Nation’s Report Card performance: Better than average
- Graduation rate: 79.7% (40th)
- Total enrollment: 274,849 (39th)
- Total spending: $1.97 billion (44th)

49. Arizona
- Per pupil current spending: $7,613 (49th)
- Per pupil current spending change from 2015: 1.6%
- Average teacher salary: $47,403 (45th)
- Nation’s Report Card performance: Worse than average
- Graduation rate: 79.5% (43rd)
- Total enrollment: 938,274 (16th)
- Total spending: $7.28 billion (25th)

48. Oklahoma
- Per pupil current spending: $8,097 (48th)
- Per pupil current spending change from 2015: 0.2%
- Average teacher salary: $45,245 (49th)
- Nation’s Report Card performance: Worse than average
- Graduation rate: 81.6% (36th)
- Total enrollment: 672,777 (26th)
- Total spending: $5.47 billion (30th)

47. Mississippi
- Per pupil current spending: $8,702 (47th)
- Per pupil current spending change from 2015: 2.9%
- Average teacher salary: $42,925 (50th)
- Nation’s Report Card performance: Significantly worse than average
- Graduation rate: 82.3% (34th)
- Total enrollment: 486,245 (33rd)
- Total spending: $4.25 billion (33rd)


46. North Carolina
- Per pupil current spending: $8,792 (46th)
- Per pupil current spending change from 2015: 1.2%
- Average teacher salary: $49,837 (35th)
- Nation’s Report Card performance: Worse than average
- Graduation rate: 85.9% (22nd)
- Total enrollment: 1,462,036 (9th)
- Total spending: $12.92 billion (13th)


45. Tennessee
- Per pupil current spending: $8,810 (45th)
- Per pupil current spending change from 2015: 1.0%
- Average teacher salary: $48,456 (40th)
- Nation’s Report Card performance: Worse than average
- Graduation rate: 88.5% (8th)
- Total enrollment: 999,265 (15th)
- Total spending: $8.89 billion (21st)


44. Florida
- Per pupil current spending: $8,920 (44th)
- Per pupil current spending change from 2015: 0.4%
- Average teacher salary: $49,407 (36th)
- Nation’s Report Card performance: About average
- Graduation rate: 80.7% (37th)
- Total enrollment: 2,776,933 (3rd)
- Total spending: $25.34 billion (7th)

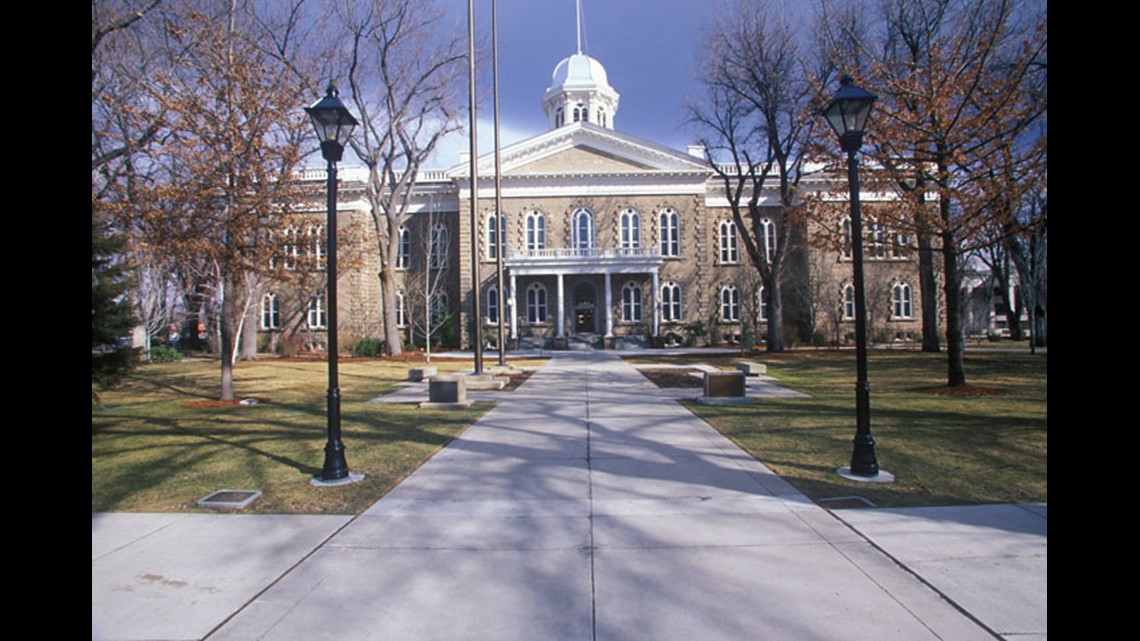
43. Nevada
- Per pupil current spending: $8,960 (43rd)
- Per pupil current spending change from 2015: 4.0%
- Average teacher salary: $57,376 (18th)
- Nation’s Report Card performance: Significantly worse than average
- Graduation rate: 73.6% (49th)
- Total enrollment: 441,623 (35th)
- Total spending: $3.98 billion (35th)


42. Texas
- Per pupil current spending: $9,016 (42nd)
- Per pupil current spending change from 2015: 1.7%
- Average teacher salary: $52,575 (26th)
- Nation’s Report Card performance: Worse than average
- Graduation rate: 89.1% (5th)
- Total enrollment: 5,053,291 (2nd)
- Total spending: $45.89 billion (3rd)

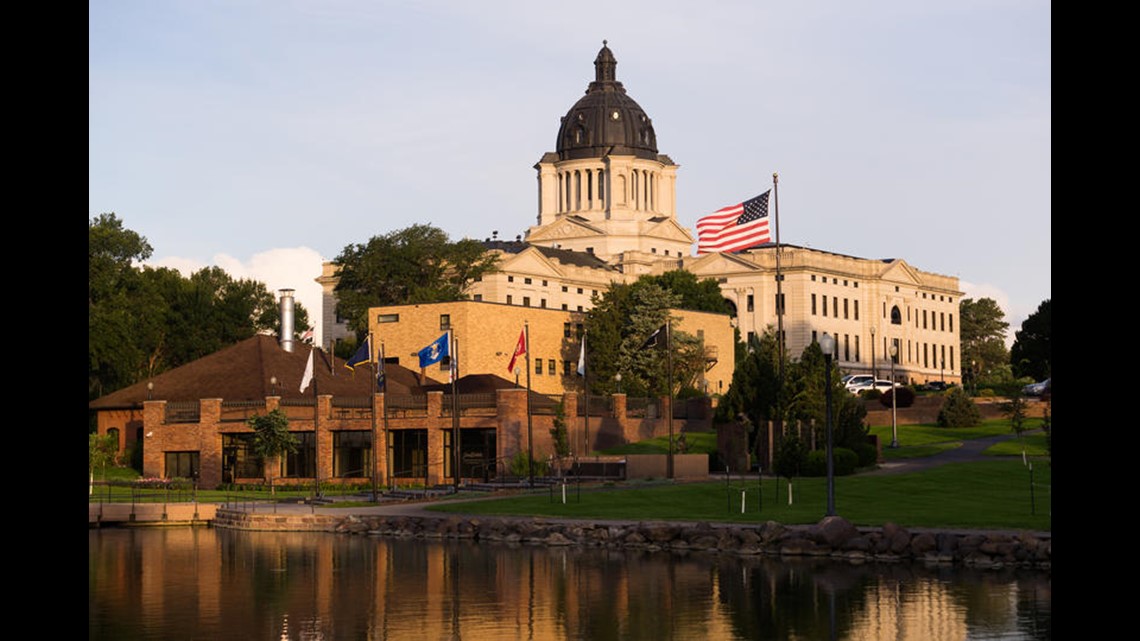
41. South Dakota
- Per pupil current spending: $9,176 (41st)
- Per pupil current spending change from 2015: 2.7%
- Average teacher salary: $42,668 (51st)
- Nation’s Report Card performance: About average
- Graduation rate: 83.9% (28th)
- Total enrollment: 134,045 (44th)
- Total spending: $1.25 billion (50th)

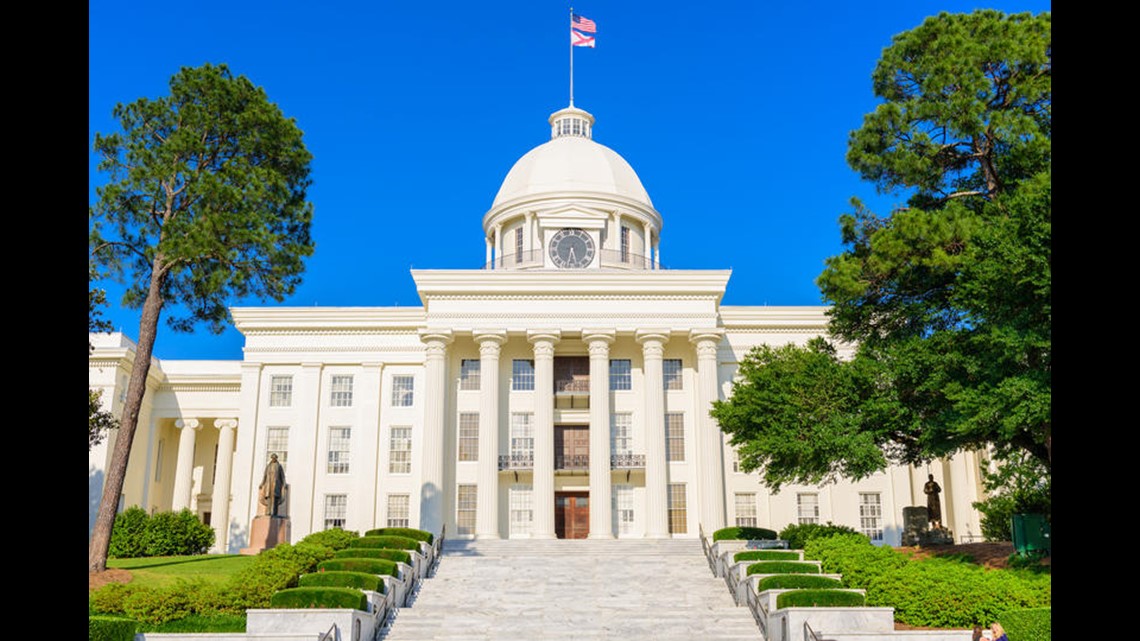
40. Alabama
- Per pupil current spending: $9,236 (40th)
- Per pupil current spending change from 2015: 1.2%
- Average teacher salary: $48,868 (37th)
- Nation’s Report Card performance: Significantly worse than average
- Graduation rate: 87.1% (16th)
- Total enrollment: 734,652 (24th)
- Total spending: $6.91 billion (26th)

39. Colorado
- Per pupil current spending: $9,575 (39th)
- Per pupil current spending change from 2015: 3.6%
- Average teacher salary: $46,506 (47th)
- Nation’s Report Card performance: Better than average
- Graduation rate: 78.9% (45th)
- Total enrollment: 880,678 (19th)
- Total spending: $8.52 billion (22nd)
38. New Mexico
- Per pupil current spending: $9,693 (38th)
- Per pupil current spending change from 2015: -0.6%
- Average teacher salary: $47,500 (44th)
- Nation’s Report Card performance: Significantly worse than average
- Graduation rate: 71.0% (50th)
- Total enrollment: 319,861 (36th)
- Total spending: $3.10 billion (38th)
37. Georgia
- Per pupil current spending: $9,769 (37th)
- Per pupil current spending change from 2015: 3.6%
- Average teacher salary: $54,602 (24th)
- Nation’s Report Card performance: About average
- Graduation rate: 79.4% (44th)
- Total enrollment: 1,727,085 (6th)
- Total spending: $17.12 billion (9th)

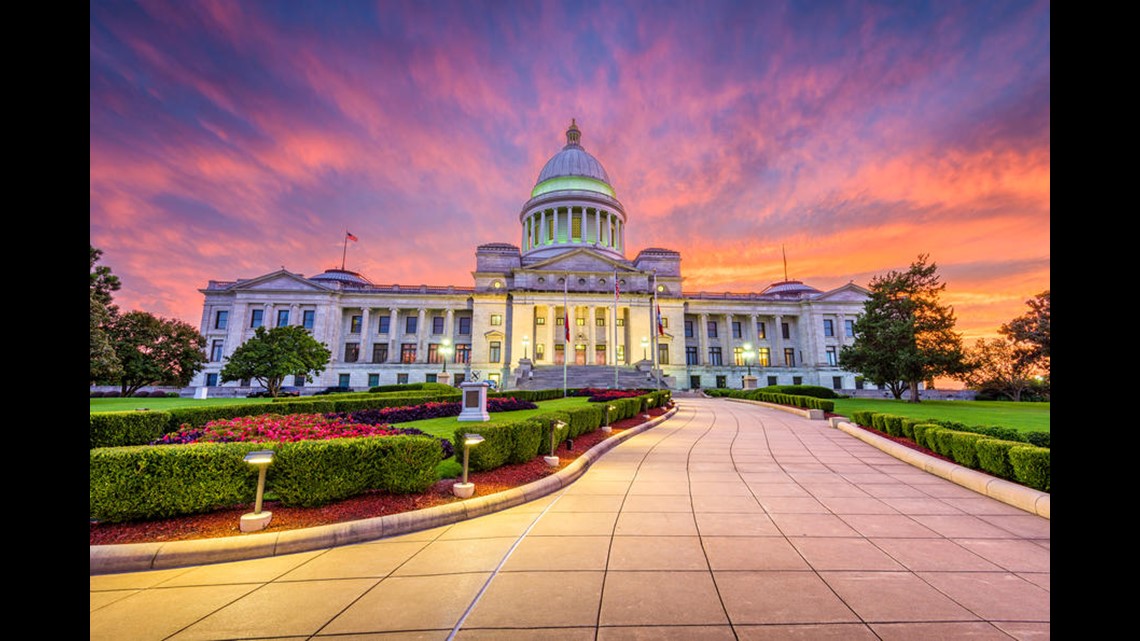
36. Arkansas
- Per pupil current spending: $9,846 (36th)
- Per pupil current spending change from 2015: 1.6%
- Average teacher salary: $48,616 (38th)
- Nation’s Report Card performance: Significantly worse than average
- Graduation rate: 87.0% (17th)
- Total enrollment: 479,177 (34th)
- Total spending: $4.75 billion (32nd)

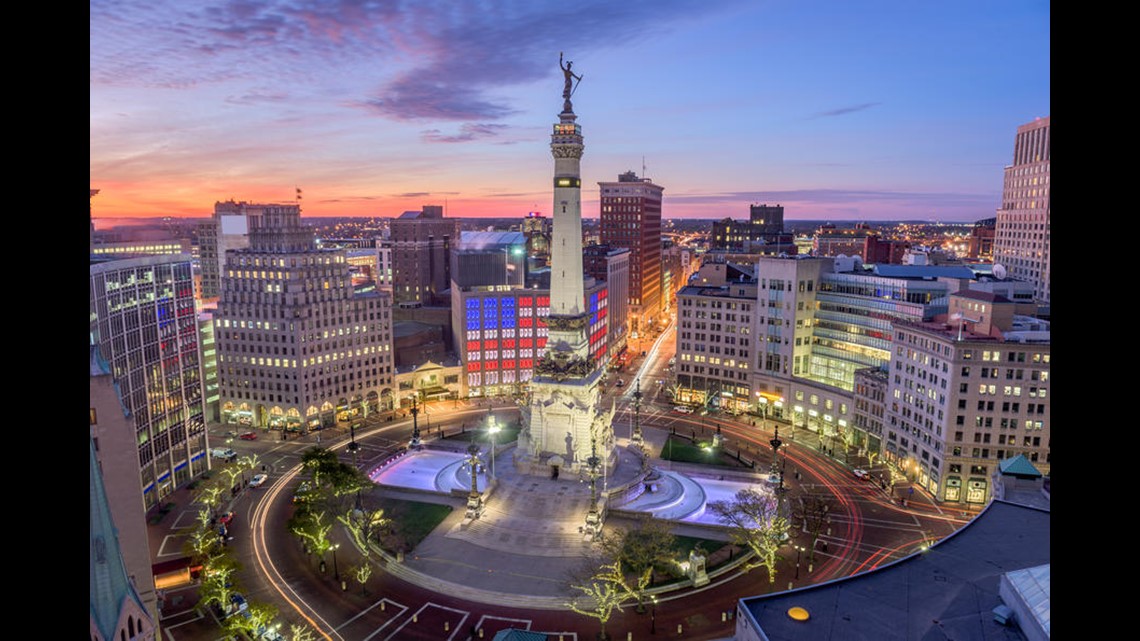
35. Indiana
- Per pupil current spending: $9,856 (35th)
- Per pupil current spending change from 2015: 1.7%
- Average teacher salary: $50,554 (33rd)
- Nation’s Report Card performance: Significantly better than average
- Graduation rate: 86.8% (19th)
- Total enrollment: 1,002,696 (14th)
- Total spending: $9.96 billion (18th)

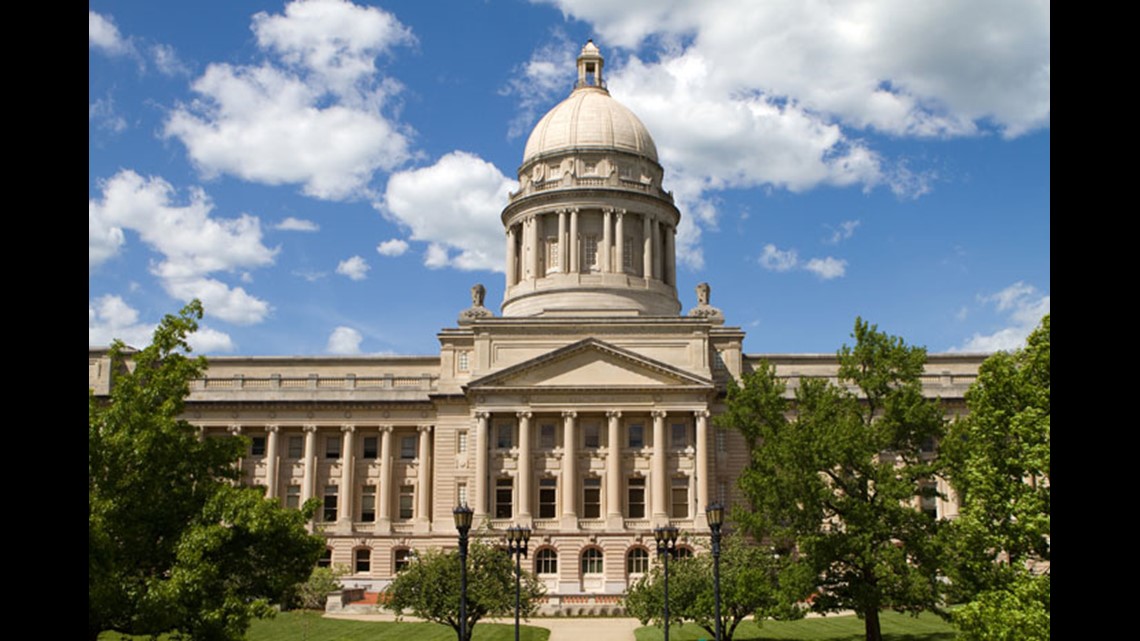
34. Kentucky
- Per pupil current spending: $9,863 (34th)
- Per pupil current spending change from 2015: 2.4%
- Average teacher salary: $52,339 (27th)
- Nation’s Report Card performance: Worse than average
- Graduation rate: 88.6% (7th)
- Total enrollment: 686,440 (25th)
- Total spending: $6.83 billion (27th)
33. Kansas
- Per pupil current spending: $9,960 (33rd)
- Per pupil current spending change from 2015: -0.8%
- Average teacher salary: $47,984 (42nd)
- Nation’s Report Card performance: About average
- Graduation rate: 85.7% (23rd)
- Total enrollment: 495,545 (32nd)
- Total spending: $4.94 billion (31st)

32. South Carolina
- Per pupil current spending: $10,249 (32nd)
- Per pupil current spending change from 2015: 3.0%
- Average teacher salary: $48,598 (39th)
- Nation’s Report Card performance: Significantly worse than average
- Graduation rate: 82.6% (33rd)
- Total enrollment: 743,320 (23rd)
- Total spending: $7.75 billion (23rd)


31. Missouri
- Per pupil current spending: $10,313 (31st)
- Per pupil current spending change from 2015: 1.6%
- Average teacher salary: $48,293 (41st)
- Nation’s Report Card performance: About average
- Graduation rate: 89.0% (6th)
- Total enrollment: 891,554 (18th)
- Total spending: $9.42 billion (20th)


30. Oregon
- Per pupil current spending: $10,842 (30th)
- Per pupil current spending change from 2015: 3.8%
- Average teacher salary: $61,631 (12th)
- Nation’s Report Card performance: About average
- Graduation rate: 74.8% (48th)
- Total enrollment: 574,252 (29th)
- Total spending: $6.46 billion (28th)


29. Louisiana
- Per pupil current spending: $11,038 (29th)
- Per pupil current spending change from 2015: 0.3%
- Average teacher salary: $50,000 (34th)
- Nation’s Report Card performance: Significantly worse than average
- Graduation rate: 78.6% (46th)
- Total enrollment: 660,561 (27th)
- Total spending: $7.31 billion (24th)

28. Iowa
- Per pupil current spending: $11,150 (28th)
- Per pupil current spending change from 2015: 1.9%
- Average teacher salary: $55,443 (22nd)
- Nation’s Report Card performance: Better than average
- Graduation rate: 91.3% (1st)
- Total enrollment: 508,014 (30th)
- Total spending: $5.69 billion (29th)


27. West Virginia
- Per pupil current spending: $11,291 (27th)
- Per pupil current spending change from 2015: -0.6%
- Average teacher salary: $45,701 (48th)
- Nation’s Report Card performance: Significantly worse than average
- Graduation rate: 89.8% (3rd)
- Total enrollment: 276,764 (38th)
- Total spending: $3.17 billion (37th)


26. Montana
- Per pupil current spending: $11,348 (26th)
- Per pupil current spending change from 2015: 2.9%
- Average teacher salary: $51,422 (30th)
- Nation’s Report Card performance: About average
- Graduation rate: 85.6% (24th)
- Total enrollment: 145,240 (43rd)
- Total spending: $1.66 billion (46th)


25. Virginia
- Per pupil current spending: $11,432 (25th)
- Per pupil current spending change from 2015: 1.7%
- Average teacher salary: $51,049 (32nd)
- Nation’s Report Card performance: Significantly better than average
- Graduation rate: 86.7% (20th)
- Total enrollment: 1,283,493 (12th)
- Total spending: $14.75 billion (12th)


24. Wisconsin
- Per pupil current spending: $11,456 (24th)
- Per pupil current spending change from 2015: 0.7%
- Average teacher salary: $54,998 (23rd)
- Nation’s Report Card performance: Better than average
- Graduation rate: 88.2% (9th)
- Total enrollment: 857,736 (21st)
- Total spending: $9.96 billion (17th)

23. California
- Per pupil current spending: $11,495 (23rd)
- Per pupil current spending change from 2015: 9.8%
- Average teacher salary: $78,711 (2nd)
- Nation’s Report Card performance: Worse than average
- Graduation rate: 83.0% (30th)
- Total enrollment: 6,217,031 (1st)
- Total spending: $72.64 billion (1st)


22. Washington
- Per pupil current spending: $11,534 (22nd)
- Per pupil current spending change from 2015: 7.4%
- Average teacher salary: $54,147 (25th)
- Nation’s Report Card performance: Significantly better than average
- Graduation rate: 79.7% (40th)
- Total enrollment: 1,083,973 (13th)
- Total spending: $12.57 billion (14th)

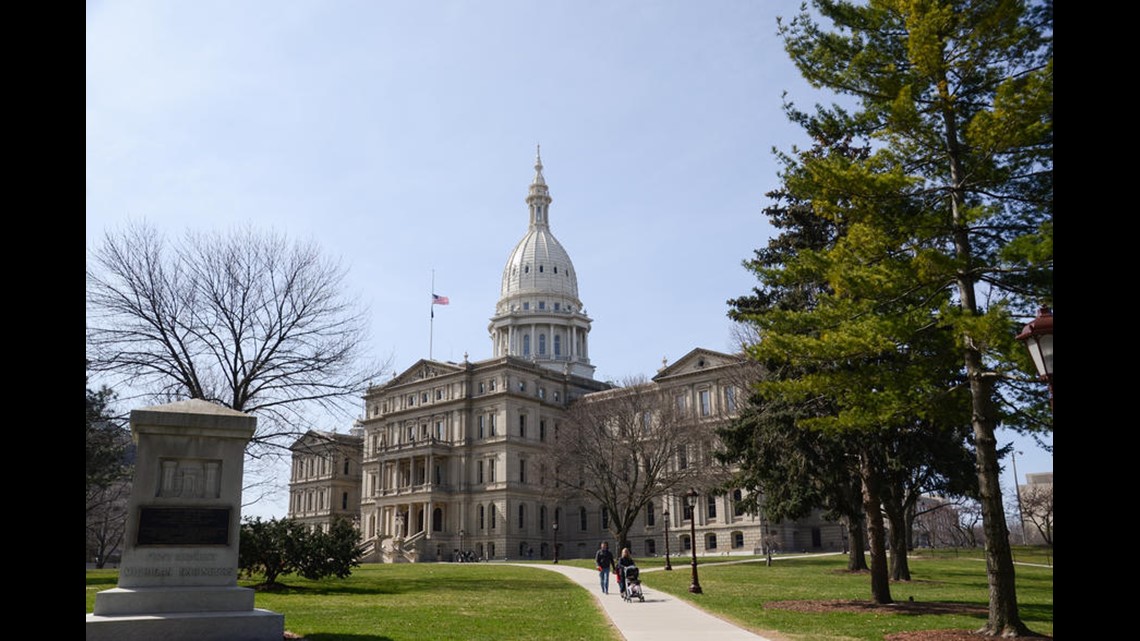
21. Michigan
- Per pupil current spending: $11,668 (21st)
- Per pupil current spending change from 2015: 1.6%
- Average teacher salary: $62,200 (11th)
- Nation’s Report Card performance: Worse than average
- Graduation rate: 79.7% (40th)
- Total enrollment: 1,335,713 (11th)
- Total spending: $15.86 billion (10th)


20. Ohio
- Per pupil current spending: $12,102 (20th)
- Per pupil current spending change from 2015: 4.0%
- Average teacher salary: $57,000 (21st)
- Nation’s Report Card performance: Better than average
- Graduation rate: 83.5% (29th)
- Total enrollment: 1,595,024 (7th)
- Total spending: $20.56 billion (8th)

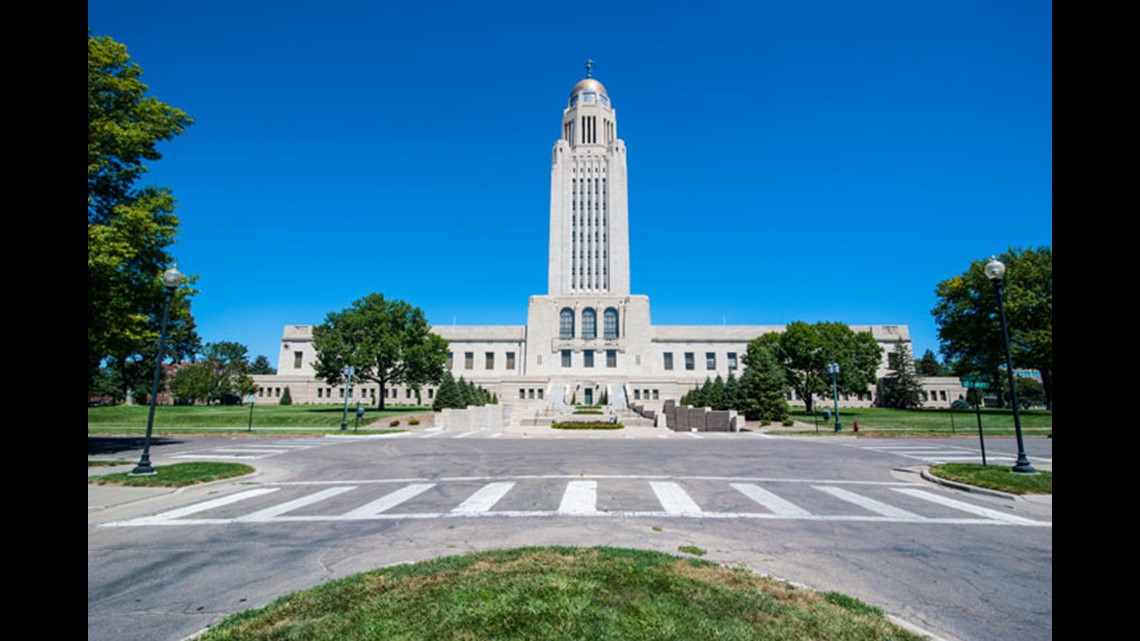
19. Nebraska
- Per pupil current spending: $12,299 (19th)
- Per pupil current spending change from 2015: 3.0%
- Average teacher salary: $52,338 (28th)
- Nation’s Report Card performance: Better than average
- Graduation rate: 89.3% (4th)
- Total enrollment: 315,542 (37th)
- Total spending: $3.88 billion (36th)

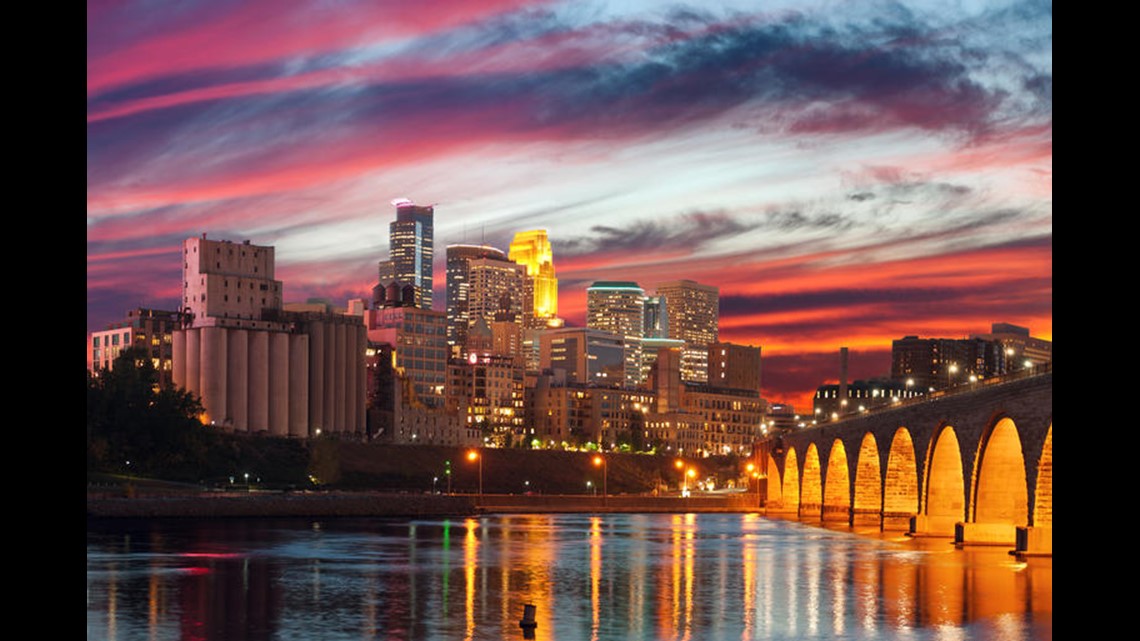
18. Minnesota
- Per pupil current spending: $12,382 (18th)
- Per pupil current spending change from 2015: 3.6%
- Average teacher salary: $57,346 (19th)
- Nation’s Report Card performance: Significantly better than average
- Graduation rate: 82.2% (35th)
- Total enrollment: 811,157 (22nd)
- Total spending: $10.52 billion (16th)


17. Maine
- Per pupil current spending: $13,278 (17th)
- Per pupil current spending change from 2015: 0.2%
- Average teacher salary: $51,077 (31st)
- Nation’s Report Card performance: About average
- Graduation rate: 87.0% (17th)
- Total enrollment: 179,879 (41st)
- Total spending: $2.49 billion (41st)
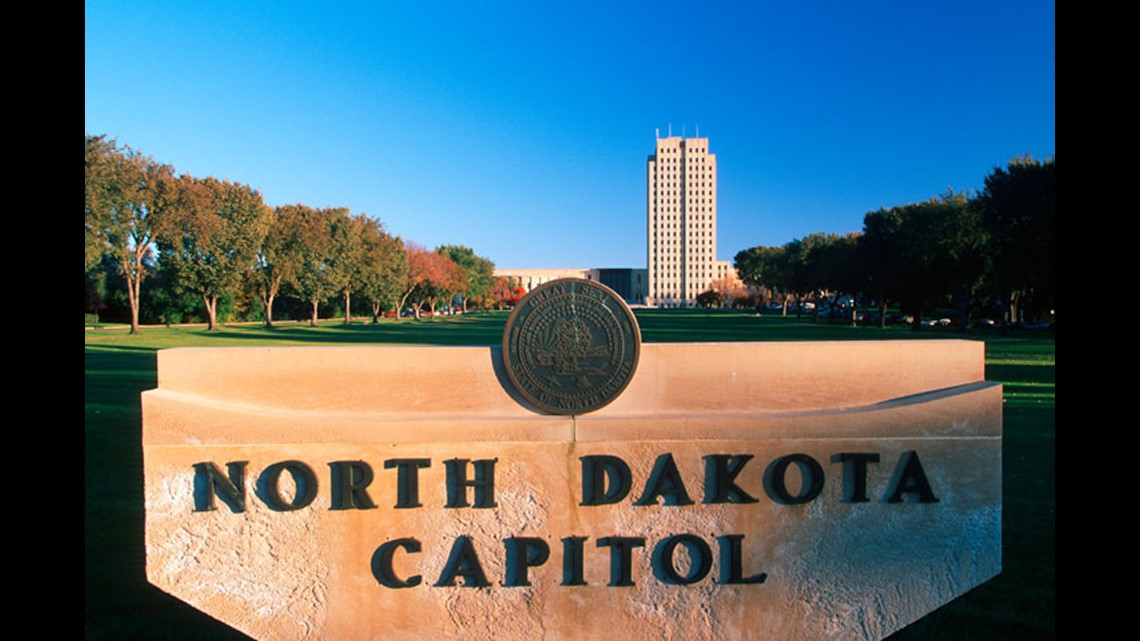
16. North Dakota
- Per pupil current spending: $13,373 (16th)
- Per pupil current spending change from 2015: 0.4%
- Average teacher salary: $51,618 (29th)
- Nation’s Report Card performance: About average
- Graduation rate: 87.5% (13th)
- Total enrollment: 108,384 (48th)
- Total spending: $1.46 billion (49th)

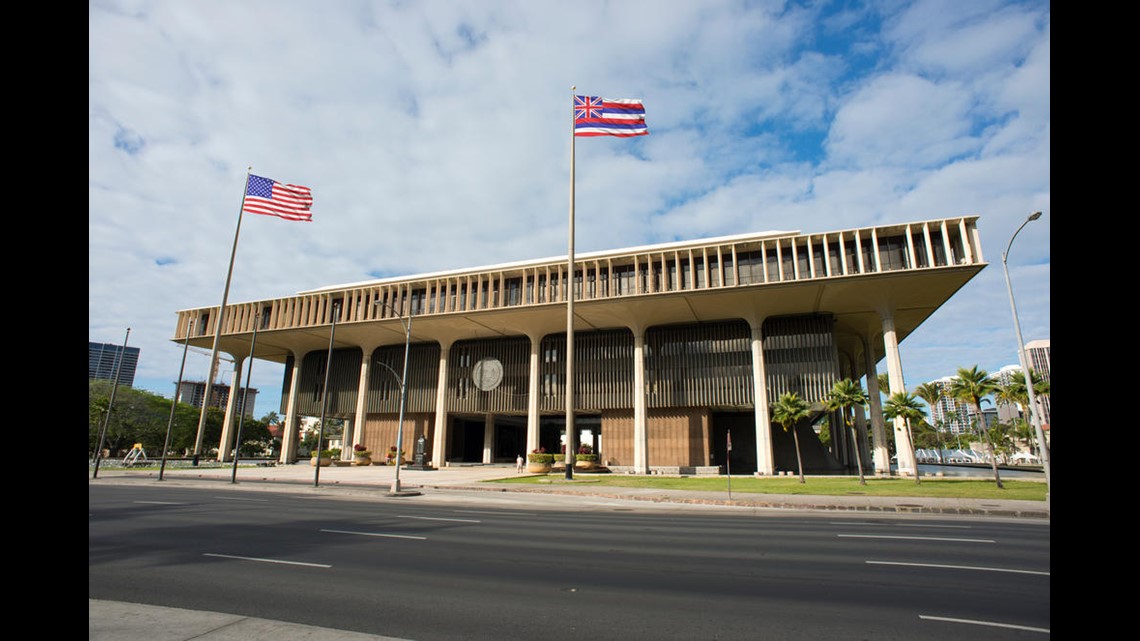
15. Hawaii
- Per pupil current spending: $13,748 (15th)
- Per pupil current spending change from 2015: 7.0%
- Average teacher salary: $57,674 (17th)
- Nation’s Report Card performance: Worse than average
- Graduation rate: 82.7% (32nd)
- Total enrollment: 181,995 (40th)
- Total spending: $2.52 billion (40th)

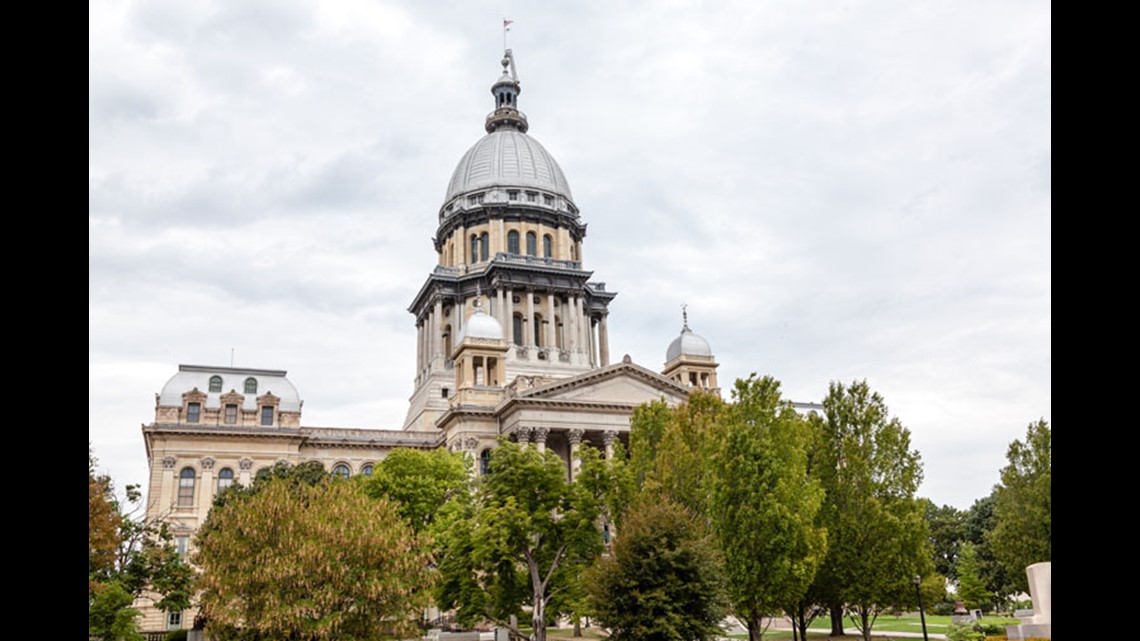
14. Illinois
- Per pupil current spending: $14,180 (14th)
- Per pupil current spending change from 2015: 3.1%
- Average teacher salary: $61,602 (13th)
- Nation’s Report Card performance: About average
- Graduation rate: 85.5% (25th)
- Total enrollment: 2,030,717 (5th)
- Total spending: $29.22 billion (4th)


13. Maryland
- Per pupil current spending: $14,206 (13th)
- Per pupil current spending change from 2015: 0.1%
- Average teacher salary: $66,961 (8th)
- Nation’s Report Card performance: About average
- Graduation rate: 87.6% (12th)
- Total enrollment: 879,196 (20th)
- Total spending: $12.52 billion (15th)

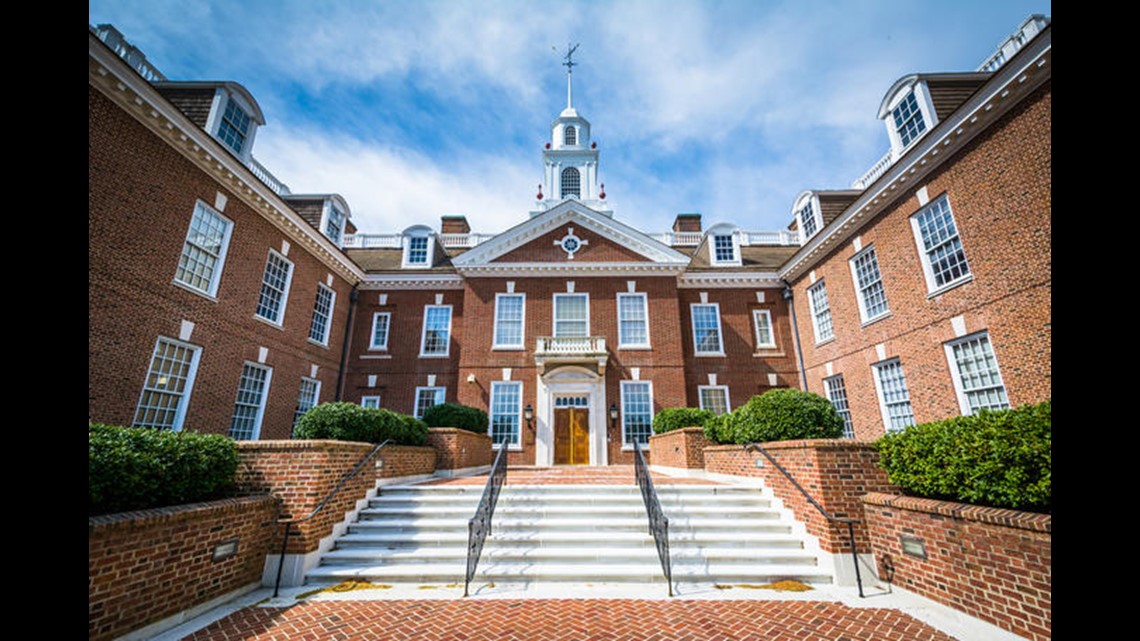
12. Delaware
- Per pupil current spending: $14,713 (12th)
- Per pupil current spending change from 2015: 4.2%
- Average teacher salary: $60,214 (14th)
- Nation’s Report Card performance: Worse than average
- Graduation rate: 85.5% (25th)
- Total enrollment: 121,225 (47th)
- Total spending: $1.85 billion (45th)

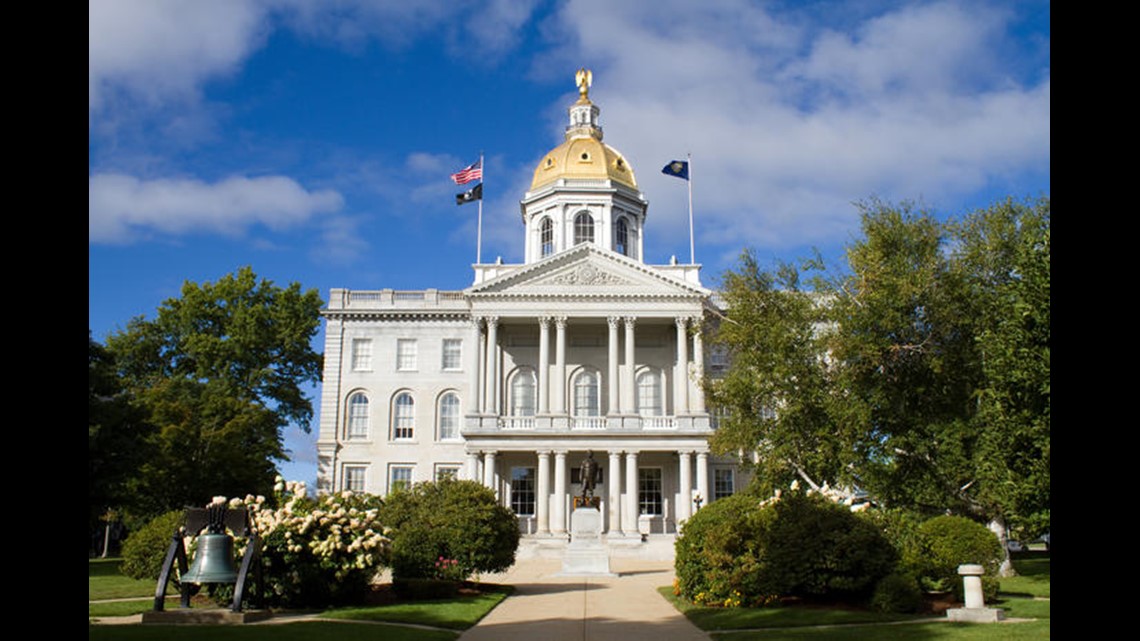
11. New Hampshire
- Per pupil current spending: $15,340 (11th)
- Per pupil current spending change from 2015: 4.4%
- Average teacher salary: $57,253 (20th)
- Nation’s Report Card performance: Significantly better than average
- Graduation rate: 88.2% (9th)
- Total enrollment: 179,682 (42nd)
- Total spending: $2.78 billion (39th)


10. Pennsylvania
- Per pupil current spending: $15,418 (10th)
- Per pupil current spending change from 2015: 4.8%
- Average teacher salary: $65,863 (10th)
- Nation’s Report Card performance: Better than average
- Graduation rate: 86.1% (21st)
- Total enrollment: 1,572,593 (8th)
- Total spending: $26.26 billion (6th)


9. Rhode Island
- Per pupil current spending: $15,532 (9th)
- Per pupil current spending change from 2015: 2.3%
- Average teacher salary: $66,477 (9th)
- Nation’s Report Card performance: Worse than average
- Graduation rate: 82.8% (31st)
- Total enrollment: 133,856 (45th)
- Total spending: $2.24 billion (43rd)


8. Massachusetts
- Per pupil current spending: $15,593 (8th)
- Per pupil current spending change from 2015: 0.0%
- Average teacher salary: $77,804 (3rd)
- Nation’s Report Card performance: Significantly better than average
- Graduation rate: 87.5% (13th)
- Total enrollment: 921,029 (17th)
- Total spending: $15.47 billion (11th)

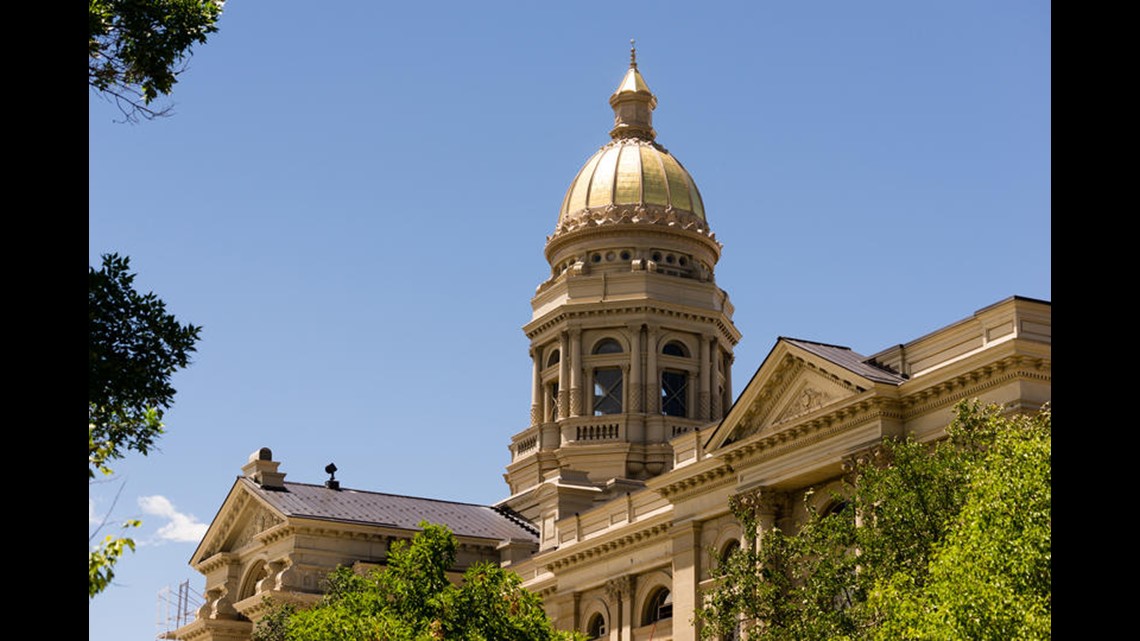
7. Wyoming
- Per pupil current spending: $16,442 (7th)
- Per pupil current spending change from 2015: 2.4%
- Average teacher salary: $58,650 (16th)
- Nation’s Report Card performance: Significantly better than average
- Graduation rate: 80.0% (39th)
- Total enrollment: 94,511 (49th)
- Total spending: $1.56 billion (48th)

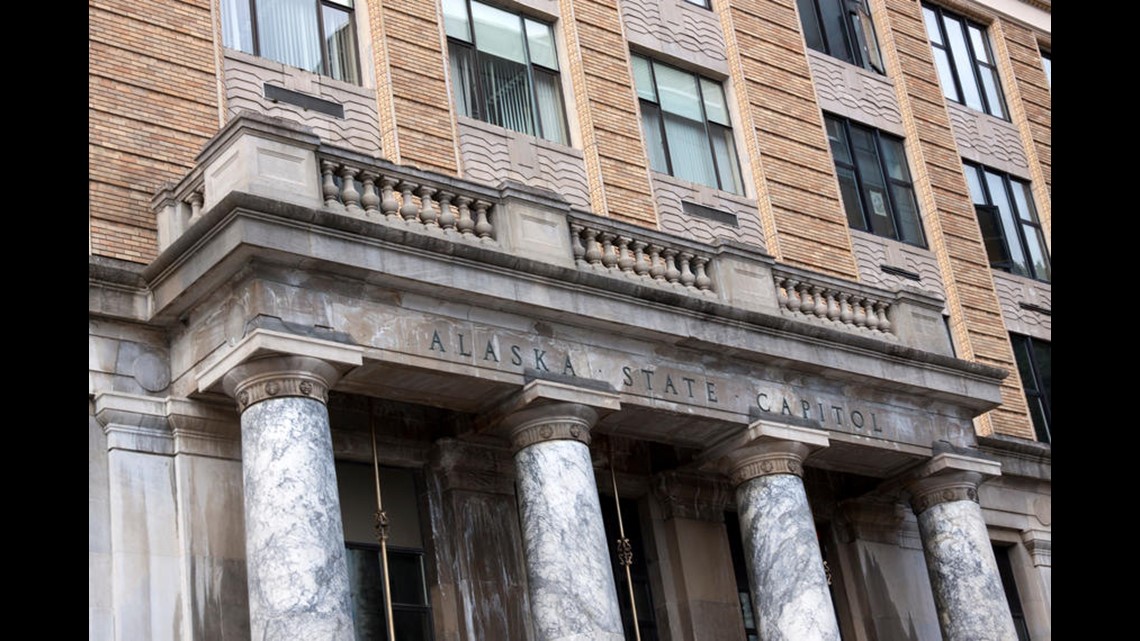
6. Alaska
- Per pupil current spending: $17,510 (6th)
- Per pupil current spending change from 2015: -13.2%
- Average teacher salary: $68,138 (7th)
- Nation’s Report Card performance: Significantly worse than average
- Graduation rate: 76.1% (47th)
- Total enrollment: 132,477 (46th)
- Total spending: $2.33 billion (42nd)

5. Vermont
- Per pupil current spending: $17,873 (5th)
- Per pupil current spending change from 2015: -0.9%
- Average teacher salary: $60,187 (15th)
- Nation’s Report Card performance: Significantly better than average
- Graduation rate: 87.7% (11th)
- Total enrollment: 87,974 (50th)
- Total spending: $1.65 billion (47th)

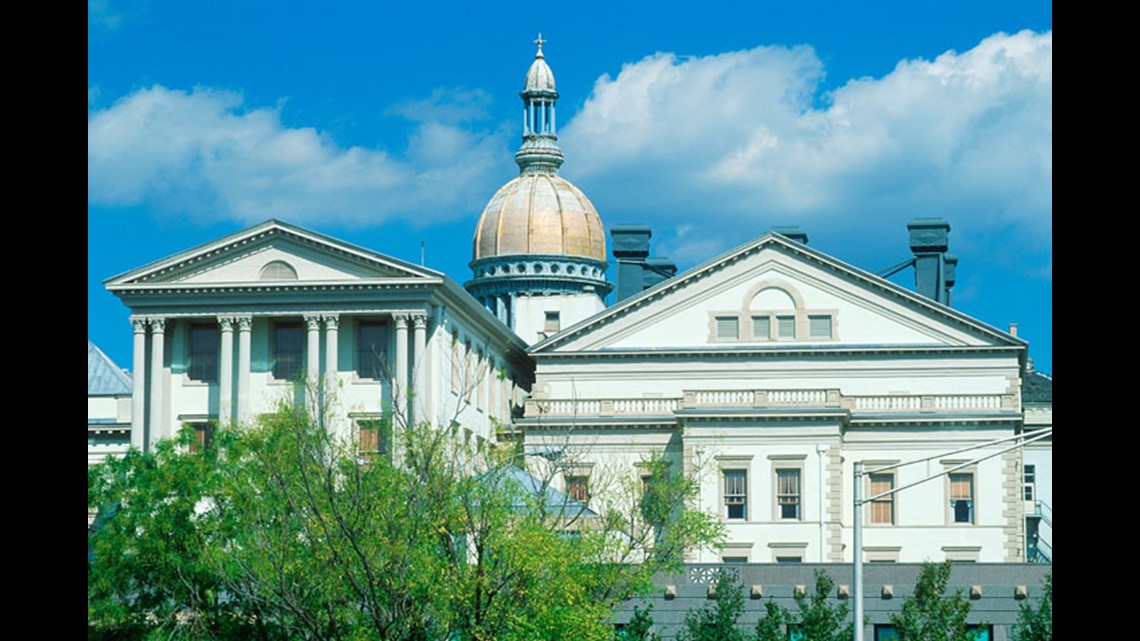
4. New Jersey
- Per pupil current spending: $18,402 (4th)
- Per pupil current spending change from 2015: 0.9%
- Average teacher salary: $69,623 (6th)
- Nation’s Report Card performance: Significantly better than average
- Graduation rate: 90.1% (2nd)
- Total enrollment: 1,364,473 (10th)
- Total spending: $26.76 billion (5th)


3. Connecticut
- Per pupil current spending: $18,958 (3rd)
- Per pupil current spending change from 2015: 3.2%
- Average teacher salary: $72,561 (5th)
- Nation’s Report Card performance: Better than average
- Graduation rate: 87.4% (15th)
- Total enrollment: 499,494 (31st)
- Total spending: $9.80 billion (19th)

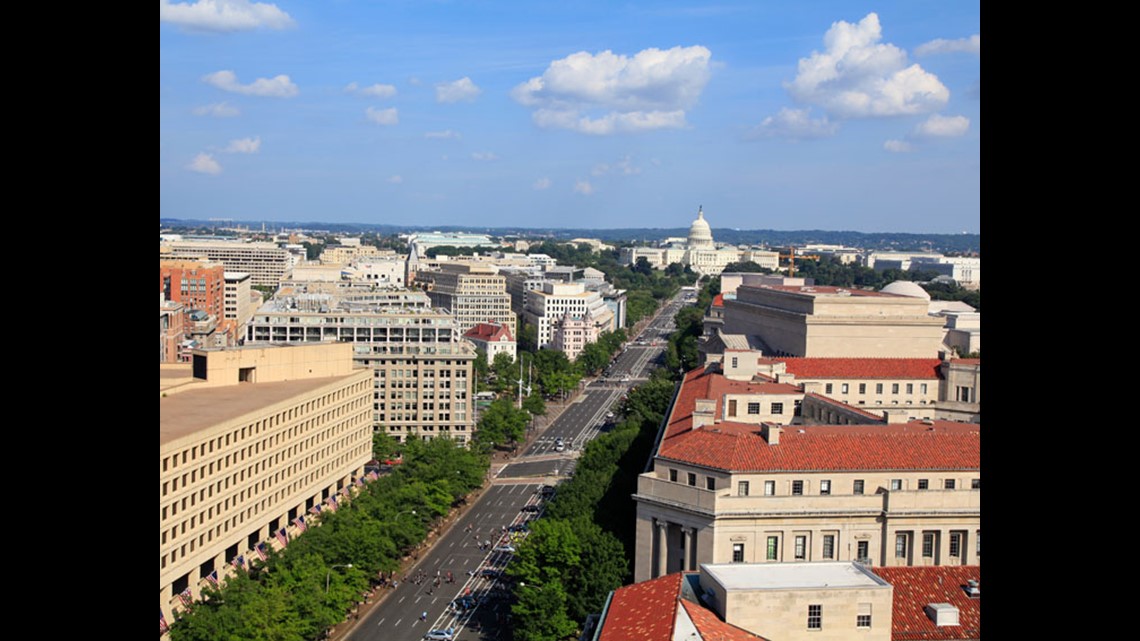
2. District of Columbia
- Per pupil current spending: $19,159 (2nd)
- Per pupil current spending change from 2015: -1.2%
- Average teacher salary: $76,131 (4th)
- Nation’s Report Card performance: Significantly worse than average
- Graduation rate: 69.2% (51st)
- Total enrollment: 48,336 (51st)
- Total spending: $1.01 billion (51st)


1. New York
- Per pupil current spending: $22,366 (1st)
- Per pupil current spending change from 2015: 5.5%
- Average teacher salary: $79,637 (1st)
- Nation’s Report Card performance: About average
- Graduation rate: 80.4% (38th)
- Total enrollment: 2,590,945 (4th)
- Total spending: $61.45 billion (2nd)
Methodology:
Unless otherwise noted, the data presented in this analysis is for public elementary and secondary schools only.
Current spending and enrollment statistics are from the U.S. Census Bureau, “Annual Survey of School System Finances” (2016), released in May of 2018. Current spending represents the amount spent by schools on daily operations, not including debt service, capital outlay, or reimbursement to other governments. Teacher salary statistics are from the National Education Association, Estimates of School Statistics, 2016-17. High school graduation rates are from the U.S. Department of Education, EDFacts Data (2015-2016). The graduation rate presented is the public high school 4-year adjusted cohort graduation rate.
Nation’s Report Card performance was evaluated using 2017 data from the Institute of Education Sciences, National Assessment of Educational Progress (NAEP) Math and Reading assessments for 8th grade students. For each state, the NAEP Math and Reading scores were averaged. The resulting averages were converted to percentiles and given qualitative scores.
The list of states is ranked by per pupil current spending for Fiscal Year 2016.